Field notes: the season the rains looked fine on the chart and the herders moved anyway
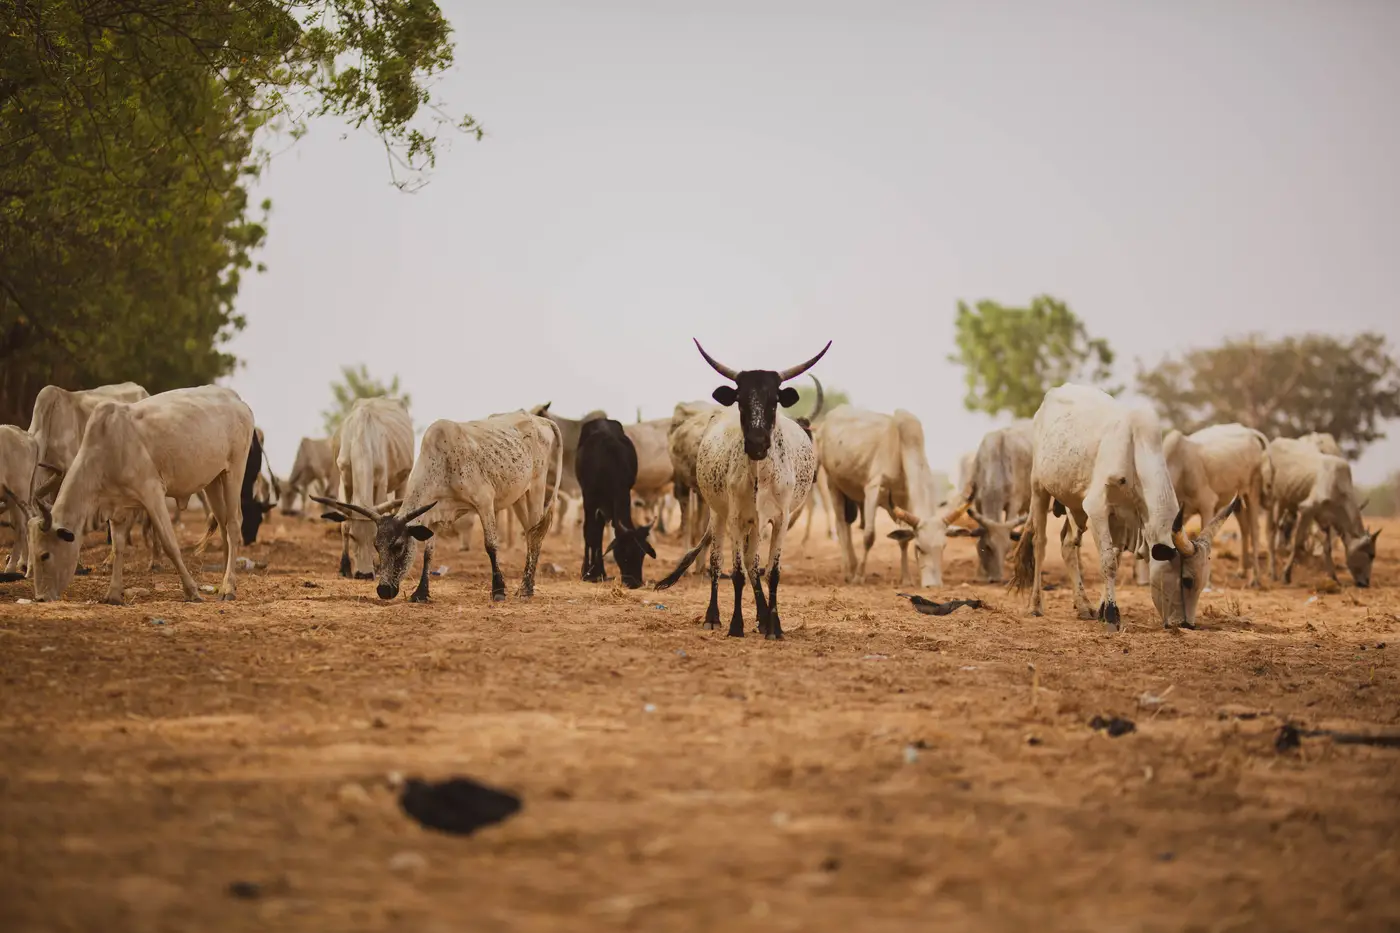
There's a particular kind of unease that comes from pulling up a rainfall anomaly chart, seeing the bars sitting close to the long-term mean, and then hearing from a field officer that herds are already thirty kilometers off their usual wet-season range. The chart says normal. The migration pattern says otherwise. You sit with that for a minute before you decide which one you trust.
I had a season like that a few years back. Cumulative rainfall for the quarter came in within about ten percent of the long-term average for the zone, which on any dashboard reads as unremarkable. Green, maybe pale yellow. Nothing that would normally pull an anticipatory-action trigger.
But the distribution inside that quarter was ugly: a wet start that greened up the shrub layer fast, then a six-week gap right through the period when grasses need steady moisture to set seed, then a late burst that came too fast and ran off instead of soaking in. Add it all up and the total looks fine. Walk the ground and the pasture is thin, woody, and already curing out weeks early.
Herders know this before any analyst does, because they're reading soil moisture with their feet and pasture quality with their eyes, not with a monthly composite. By the time our cumulative numbers caught up to what was obviously happening, the early movers were already at the dry-season reserve areas, a month ahead of the usual calendar. The ones who waited for a "confirmed" bad season, the ones whose cooperative or local authority wanted to see the chart turn red before authorizing a response, were competing for grazing with herds that had a month's head start and fatter animals to show for it.
This is the part of the job that's hard to put in a trigger document: a seasonal total can be average while the season itself was never normal. Rain that falls in the wrong window does almost nothing for standing biomass, but it still counts toward the cumulative anomaly the same as rain that falls exactly when the grass needs it. A single number per zone, checked once a month against the seasonal norm, will usually catch this eventually, because vegetation condition itself (not just the rain that produced it) starts drifting away from normal once the dry spell bites into the grass. But "eventually" is the word that costs you. If the layer you're watching is lagging by a composite cycle or by a reporting delay, you've already lost the two or three weeks that would have let the trigger fire ahead of the herders instead of behind them.
What that season taught me, and what I keep relearning every time someone hands me a dashboard that looks fine, is that the anomaly number is only useful if you also know when in the season it was measured against and how fast you're getting it. A greenness index pulled and plotted a month late tells you what already happened. One that lands close to real time, zone by zone, at least gives the calendar a chance to move before the field reports become the only honest signal left. That's the gap we built Food Security Warning around: a monthly vegetation and rainfall anomaly reading for your cropping and grazing zones, delivered as the one number your trigger document already runs on, so the calendar isn't waiting on a manual pull-and-plot to catch up to what the herders already know.
I still pull the rainfall totals every month, because they matter for a dozen other reasons. But I've stopped trusting a "normal" seasonal total on its own to mean the pasture is fine. Ask the vegetation layer, not just the rain gauge, and ask it as close to real time as you can get. The herders already have.
If your calendar needs that same read without the manual pull-and-plot, see how Food Security Warning delivers it.