Cropping zone vs. grazing zone: reading an anomaly layer right
If you've ever pulled a vegetation anomaly layer and watched one admin unit show "below normal" while the calendar entry for that unit was written against a herding population, you've already hit the problem this post is about. The anomaly number is only useful if you know what land use it's measuring. A single pixel-level drop means something different under maize than under open rangeland, and the zone boundary you use to aggregate it matters just as much as the anomaly itself.
What actually separates a cropping zone from a grazing zone
A cropping zone is land under a recognized planting and harvest calendar: tilled fields, irrigation command areas, the agropastoral belts where a household grows a staple even if they also keep a few animals. The anomaly reading on that zone should be checked against the crop's known growth stages. A dip in greenness during the vegetative or flowering window carries weight. The same dip after harvest, when fields are supposed to be brown stubble, is just the calendar doing its job and not a signal at all.
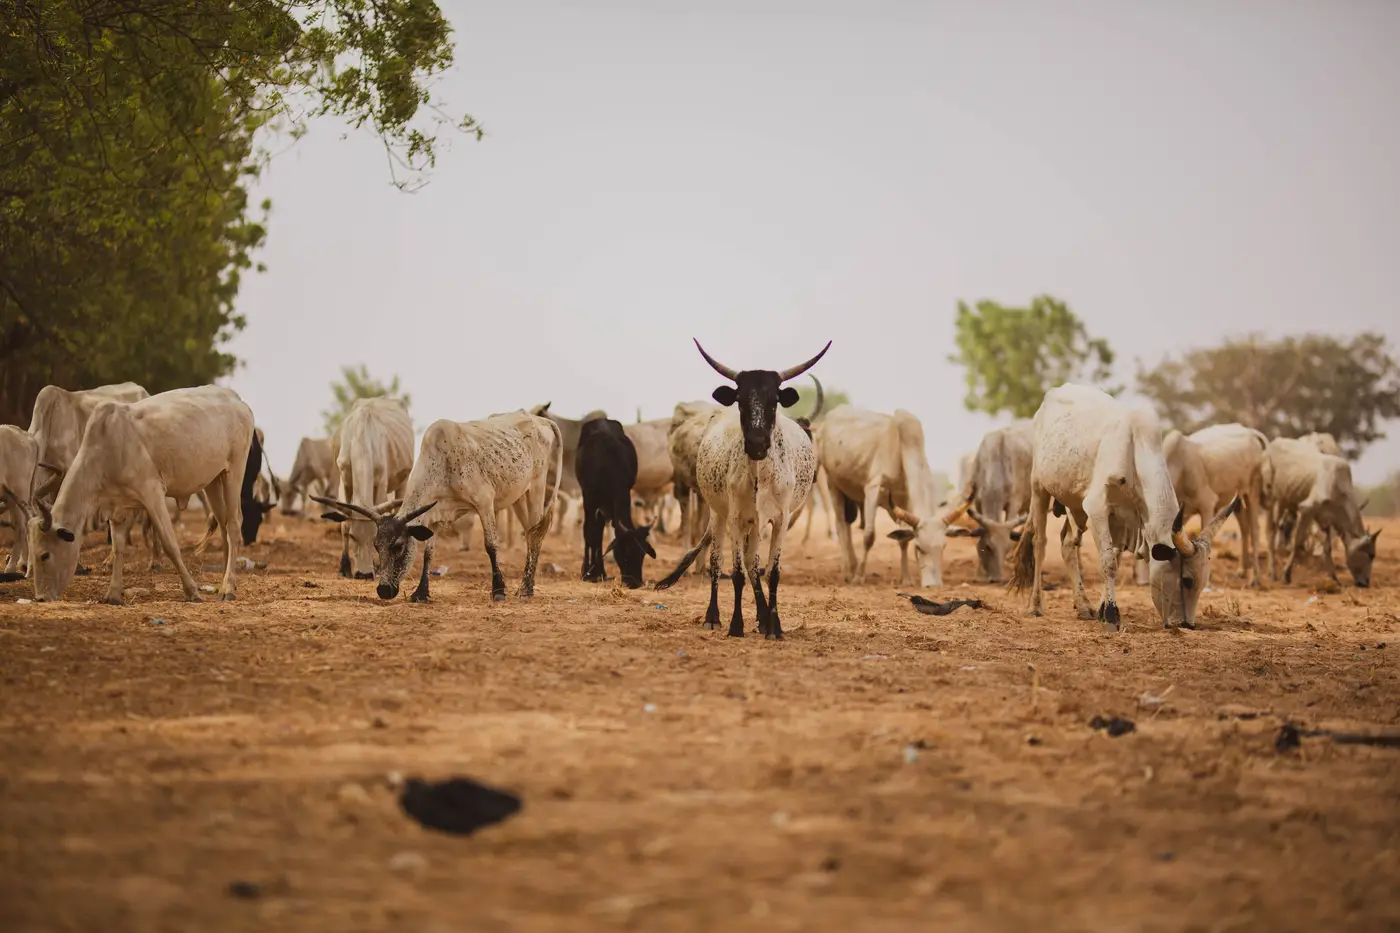
A grazing zone is rangeland, communal pasture, or transhumance corridor where vegetation condition stands in for forage availability rather than yield. There's no planting date to anchor against. Instead you're watching the anomaly against the long-run seasonal norm for that specific pasture, because pastoral households respond to forage scarcity on a different timeline than farmers respond to a failed crop. A grazing zone reading below normal in month three of the dry season might be entirely ordinary. The same reading in month one is the thing that moves a trigger.
The confusion mostly shows up at the edges. Agropastoral belts carry both uses on the same land in different seasons, and some administrative units lump a river-fed cropping strip in with the surrounding rangeland because that's how the shapefile was drawn twenty years ago, not because the land behaves the same way. If your zone boundary file treats both as one unit, the anomaly you read is an average of two different physical processes, and it will look calmer than either one actually is.
Reading the anomaly against the right calendar
Once you know which kind of zone you're looking at, the anomaly layer tells you two different things.
For a cropping zone, line the anomaly up against the crop's current growth stage. A below-normal reading during germination or flowering flags stress that can still translate into a yield shortfall. A below-normal reading in the weeks before scheduled harvest is lower priority, because the plant has mostly already made its yield.
For a grazing zone, there's no stage to check against; you're watching the cumulative trend instead. One month of below-normal vegetation on pasture rarely means anything on its own. Two or three consecutive months, especially stacked on a weak preceding wet season, typically push a pastoral trigger, because forage deficits compound across a dry season in a way a single crop failure doesn't.
This is also why pulling a zone-level anomaly number by hand, cross-checking it against a land-use layer, and re-labeling it before it goes into the calendar eats so much time every month. The classification itself rarely changes year to year. What changes is whether this month's number, read against the right calendar for that zone, crosses the line that should move a trigger.
That's the gap Food Security Warning is built to close: a monthly vegetation and rainfall anomaly reading delivered per zone, already set up to feed the anticipatory-action calendar instead of a spreadsheet you rebuild from scratch each cycle. If your calendar is still carrying a manual step between the anomaly pull and the trigger decision, that's worth a look.